When analyzing malware, what you see on disk is oftentimes not an accurate representation of what’s actually happening in memory.
Today’s malware has a unique way of hiding and likes to bend the rules that most computer programs follow. No matter what it is, there is always something special that makes a malicious program unique and sets it apart from a normal program.
As a Malware reverse engineer, it’s not only my job to discover what that special “thing” is, but to attempt to understand what the malicious program is really doing, and do my best to explain how and why.
The purpose of this article is to provide our readers with an understanding of how malware operates within memory. Since you need to know some basic memory terms before trying to understand how they relate to malware, we’re going to explain some concepts first.
Process Memory
Let’s start from the beginning: running a program. When a program is first executed, a copy of it is loaded into memory, and it then becomes a process. This program lives in its own process virtual address space (VAS) along with software libraries the program needs to execute correctly. There are other things that live in a process VAS, like heap and stack memory, but we don’t need to go that in-depth right now.
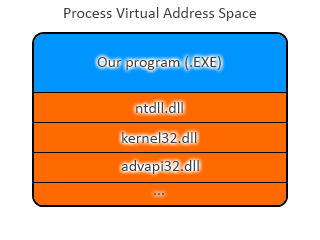
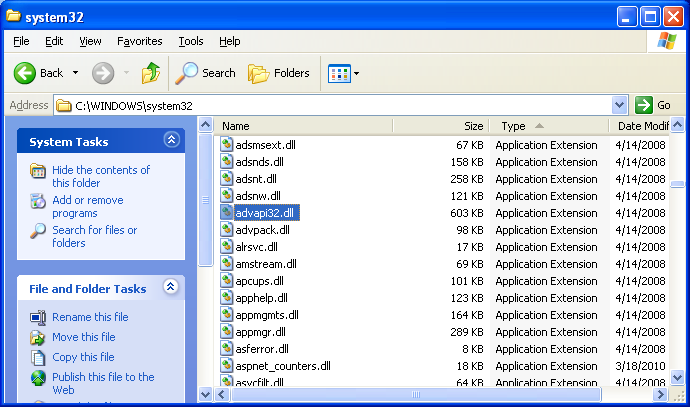
The procedure of loading the required software libraries at start-up is called dynamic linking and is commonly used in all Windows programs, including malware. The libraries that are linked are called Dynamic-Link Libraries or DLLs for short. DLLs contain functions to be used by programs and are located in OS system directories.
When using a debugger—a tool used to step through a process one instruction at a time—we can see a live picture of our process memory and better understand what’s going on. This tool is used by software developers to find bugs or errors in their code (hence the name), but can also be a powerful tool for malware analysis. OllyDbg is a great user-mode debugger that’s very popular, so much so that many spin-off versions have been created like “Shadow” and “DeRoX”.

If you’re new to using debuggers, I would recommend OllyDbg as it’s very user-friendly and easy to learn. I’m not going to explain how to debug or use this particular debugger, so I’d recommend using the Internet to find tutorials that will assist you in learning how to debug and understand Assembly Language.
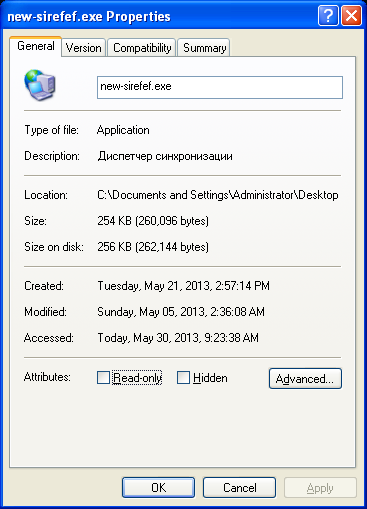
You will need to load a program into a debugger to view its memory. I’m going to use a malware executable called new-sirefef.exe, which is a variant of the popular ZeroAccess Trojan. This malware is a rootkit, a special type of malware that can subvert the Operating System itself, and therefore is more difficult to detect and remove. Below are some file properties of new-sirefef.exe.
Once we’ve loaded new-sirefef.exe into OllyDbg, we can use the memory map tool to observe our executable and dependent libraries in memory. Notice how they are distributed into pieces within the process VAS. It looks like our new-sirefef.exe program is in the virtual memory range 0x00400000-0x00443FFF.
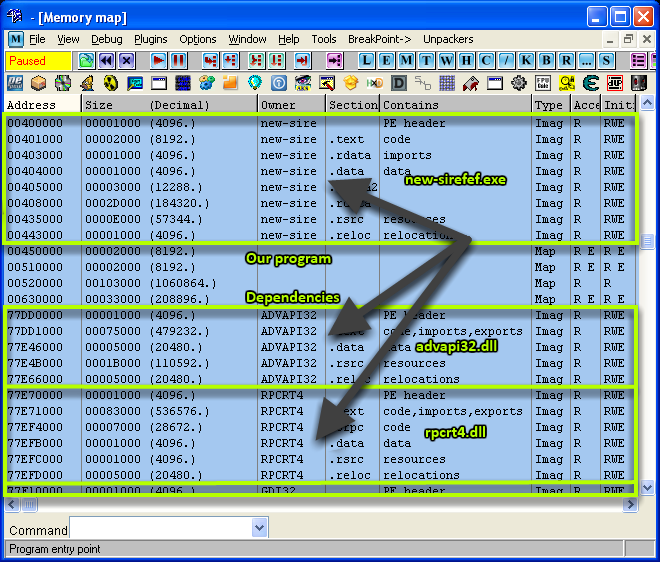
Each one of the files seen in the memory map is divided into pieces called memory sections or memory segments. This occurs because these files are Windows Portable Executable (PE) files and therefore adhere to the PE file format. For the sake of brevity, I won’t go into detail explaining the PE file specification, but you can find more information on the format from Microsoft. It’s best to become intimately familiar with this file format if you want to analyze Windows files.
Imported Functions Now, since there are hundreds of DLL files in Windows, our process needs a way to know which DLLs must be loaded into memory at start-up. The required DLL functions are located in the PE header, specifically the Import Address Table (IAT). The Import Address Table is simply a list of functions that the program must have to execute as expected. It also gives the analyst an idea of what the program does, although this can easily be faked, as we’ll see later.
Below is an image of the IAT of new-sirefef.exe as seen in IDA Pro. IDA Pro is a disassembler and debugger, and is arguably the most popular one in existence. You can see from the image that at least four DLL files will be loaded into memory at start-up: advapi32.dll, gdi32.dll, kernel32.dll, and user32.dll. However, more DLL files will be loaded, as some DLL functions are dependent on other DLL functions.
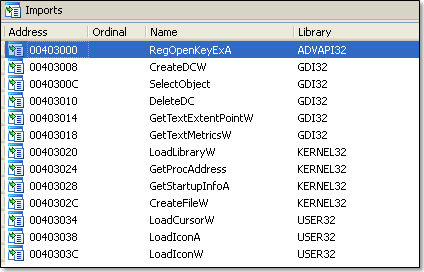
During the course of process execution, the program flow will change frequently from new-sirefef.exe to a DLL when calling functions inside of these DLLs. Since the required DLL files have already been loaded into memory at process start-up, however, this is a pretty smooth transition.
Malware in Memory Malware like new-sirefef.exe does work the same way a normal program does once it hits memory. Malware typically alters itself, using various methods before it runs like a normal program should (in some cases, it may never run like a normal program). This code alteration process is usually achieved using a software packer, a type of program used to obfuscate and/or compress the original program to inhibit analysis and reverse engineering. A software packer usually has a ‘stub’ program that runs at start-up and unpacks the original program in memory. Packers are also sometimes called cryptors, protectors, etc.
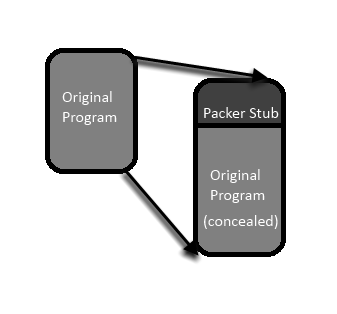
Packing helps to deter static analysis, which is analyzing the malware without running it. This is in contrast to dynamic analysis, or analyzing the malware while it’s running in live memory. If you want to perform static analysis on a packed program, you’re going to have to acquire an unpacked version first. The process of unpacking malware varies from file to file, and can take some time if performed manually.
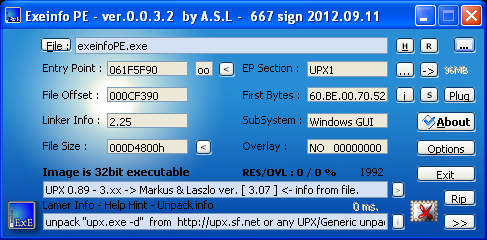
When we talk about packing, there’s really a countless number of ways to do it; in fact, it sometimes becomes difficult to keep up with them all. That’s why there are programs that exist to help you in this process. My personal favorite is Exeinfo PE, by A.S.L. (I’m sure you’ve seen this tool mentioned before in my previous writings; it’s a personal favorite). I like this program because it not only does a great job at detecting packers and cryptors, but also provides tips for unpacking, which is a great feature for a beginner. There are plenty of others, like PEiD, RDG packer detector, or DiE, but some of these tools aren’t as accurate and/or are no longer supported.
Also, now that you understand how the IAT works, know that the IAT for new-sirefef.exe is far from complete, as more functions will “unpack” as the process executes. While the functions initially present in the IAT actually do get called, most of them are just “fillers” that are there to throw you off as an analyst. We are missing a key technique that is heavily employed by malware to retrieve the important functions, and that is runtime linking.
During runtime linking, library functions are retrieved as the process executes, and thus the list of imported functions grows. Two functions from kernel32, LoadLibrary and GetProcAddress can be used to retrieve any function located in any library on a system. Notice how they’re both in the IAT for new-sirefef.exe. Thus, if you see a program that has an IAT with only these two functions, it’s a pretty good indicator there’s something to hide (usually malicious).
Our new-sirefef.exe process uses runtime linking to locate more functions for its IAT. One of these functions is a very important kernel32 function: VirtualAlloc. The VirtualAlloc function creates a new section of virtual memory in the process VAS. The base address of this new memory section in newsirefef.exe is 0x003B0000.
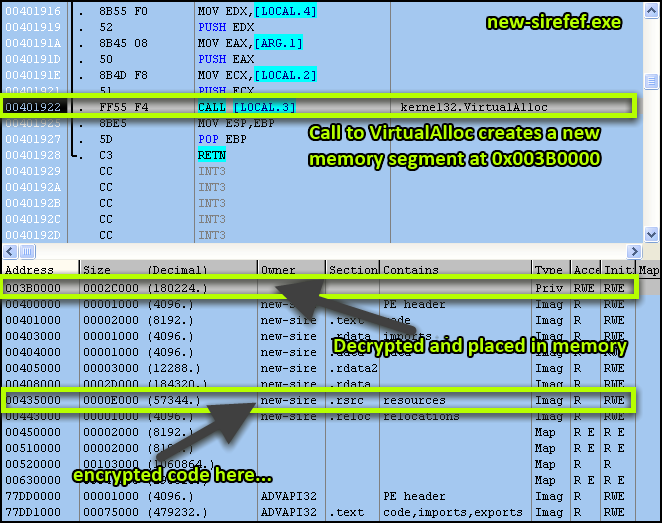
During execution, encrypted code has been moved from the .rsrc (resource) segment of new-sirefef.exe and placed into our new virtual memory. The code is then decrypted and executed within our new memory at 0x003B0000.
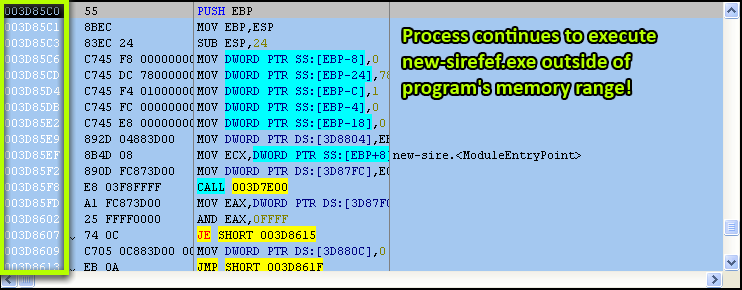
This is a very common technique used by malware, and especially packed programs. The problem is that this code is not visible on disk, and is only available in temporary or ephemeral memory. Thus if we decided to close our debugger at this point, everything in this memory segment would get discarded, and we could no longer analyze this malware.
What’s Next? In order to analyze the malware further from this point, we should find a way to copy the new memory to disk for static analysis. Stay tuned for part 2 of this article, where we’ll accomplish just that and also take a look at some other tricks this rootkit uses while unpacking.
To be continued…
References: 1. Michael Sikorski and Andrew Honig, Practical Malware Analysis: The Hands-On Guide to Dissecting Malicious Software (San Francisco: No Starch Press, 2012), 13–15.
_______________________________________________________________________________
Joshua Cannell is a Malware Intelligence Analyst at Malwarebytes where he performs research and in-depth analysis on current malware threats. He has over 5 years of experience working with US defense intelligence agencies where he analyzed malware and developed defense strategies through reverse engineering techniques. His articles on the Unpacked blog feature the latest news in malware as well as full-length technical analysis. Follow him on Twitter @joshcannell


