Debuggers—a tool traditionally used to find errors (called “bugs”) in code—are also used by security experts. In the field of malware analysis, debuggers are a vital tool used to reverse-engineer malware binaries, helping analysts to understand the purpose and functionality of malware when dynamic analysis isn’t enough.
Because they’re such a valuable tool, sometimes malware authors try to prevent analysts from using them. By employing various techniques in the code (known as “anti-debugging”), malware can successfully thwart junior analysts.
Recently I found an interesting anti-debugging technique I haven’t seen before. I discovered this technique while reversing a ZeroAccess Trojan (seems it’s always ZeroAccess lately, right?).
The technique employs various native Win32 APIs used for debugging a process. By using these APIs, the analyst cannot use their own debugger, since only one debugger can be attached to a process at a time.
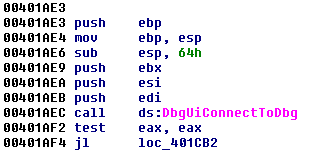
To connect to the debugger at the API level, the Trojan uses DbgUIConnectToDbg. This API along with others used to communicate with the Windows Debugger all seem to be undocumented by Microsoft.

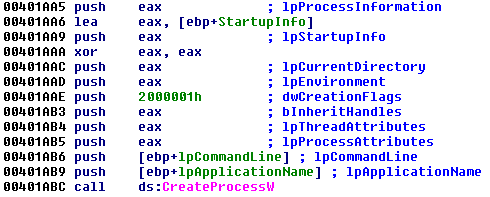
Next the Trojan creates a child process using the calling EXE (new-sirefef.exe). This was not surprising, as malware usually does this while unpacking. Allow me to explain.

Typically, a parent process creates a suspended child process using the calling EXE. Afterward, the parent will de-obfuscate some code and then place it in the child. Whenever this is complete, the parent makes a call to execute the child (usually with ResumeThread), which is now completely different from the calling EXE. And thus, while you have two processes that appear identical, they are completely different when viewed internally.

This sample doesn’t quite work this way. Under the creation flags parameter for the CreateProcess function, the CREATE_SUSPENDED flag was not being used, but instead the DEBUG_PROCESS flag. There was also another used, called CREATE_PRESERVE_CODE_AUTHZ_LEVEL (Note: for a list of process creation flags, click here).

Now both the parent and child process are being debugged, which means we can’t attach an additional debugger to either. This complicates matters as the debugger is the primary tool we use to step through code.
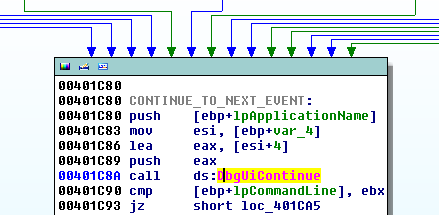
However, we can still observe what’s happening statically using our IDA dump. The parent process appears to handle debug event codes and performs an action for each event (for a list of all codes, see here). After an event has been processed the Trojan continues debugging and receives another event using DbgUiContinue.

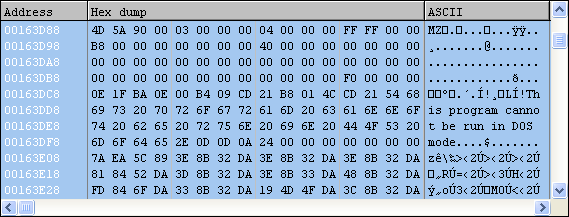
When an EXCEPTION_DEBUG_EVENT code is received, the Trojan enters a function that decrypts a PE DLL file to the heap. The new PE is then placed into the memory space of the child process.

The new PE file is actually the final unpacked version of the rootkit. We can dump the memory from here and load it into IDA to perform some static analysis. Looks like we have some websites in plain-text the Trojan is going to contact, possibly to locate the infected user (geoip_country_code).

This is just another example of how malware authors attempt to prevent reverse-engineering of their code with anti-debugging. In this example, however, the ZeroAccess Trojan does not allow the analyst to use their own debugger by connecting to the Windows Debugger itself. All in all I think it’s a very interesting technique, and we’re sure to see more of it in the future.
_______________________________________________________________________________
Joshua Cannell is a Malware Intelligence Analyst at Malwarebytes where he performs research and in-depth analysis on current malware threats. He has over 5 years of experience working with US defense intelligence agencies where he analyzed malware and developed defense strategies through reverse engineering techniques. His articles on the Unpacked blog feature the latest news in malware as well as full-length technical analysis. Follow him on Twitter @joshcannell


